Dallas Arts District: Genesis, Gift of Life at the Dallas Museum of Art

genesiscovarrubias
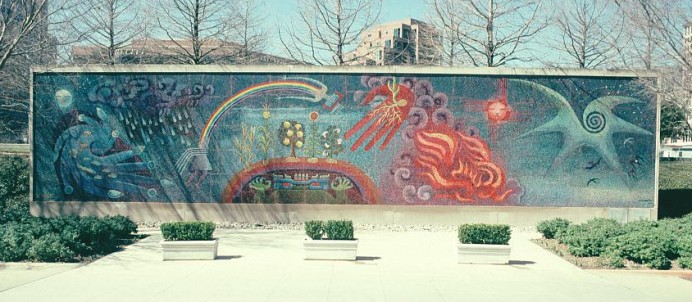
As you walk toward this striking mosaic by artist Miguel Covarrubias, invite your tour participants to look at the boundaries between regions of color in the mosaic, and identify one high-contrast boundary and one lower-contrast boundary. Then, invite the participants to come up very close to the mosaic and examine how the tiles look in the vicinity of each of the boundaries that they identified. They should see that at the high-contrast boundary the edges of the individual tiny tile lie right along the boundary, whereas at the low-contrast boundary, the tiles don’t seem to have any special relationship with the boundary and that up close, the boundary may seem to “dissolve” and be very hard to pin down a precise location for, even though the boundary was clear from far away. These observations show how the macroscopic characteristics of the image affect the microscopic characteristics of the tiny tiles that make up the image. As we’ve discussed with Spirit Inner Columns or the square stones making up the contours of the earth in earlier stops, the study of how macroscopic form connects with microscopic structure is one central and very powerful theme in mathematics, and we can appreciate it here in understanding how a mosaic artist creates different features in his work.

Before you step away from the close-up view of the mosaic, have the participants look at one region of fairly uniform color and examine it closely. Then have them step far back from the mosaic, say under the awning of the entrance to the museum, and look again at the same region of the artwork. From here, the region should look like a uniform patch of color, whereas up close you could see that there were individual tiles of different colors. The colors have blended to create just the shade the artist desired. Sometimes we call this “adding” one color to another. Is this a kind of adding that we can understand mathematically, or is it just a sort of analogy? Actually, it is something that we can make mathematical models of. An old and fairly simple model is an artist’s color wheel, such as this one. BYR_color_wheel
You can interpret this wheel as representing colors with angles around a circle; and if you want to find the result of adding two colors, you take their angle bisector. For example, yellow is at 90 degrees and blue is at 210 degrees and the green you get by mixing them is halfway in between, at 150 degrees. There are many more combinations that work this way as well, such as yellow at 90 degrees mixing with orange at 30 degrees to produce marigold at 60 degrees.

But as with any mathematical model of the real world, this angle model of color has its limitations; it can be pushed to a point where it begins to break down. For example, consider combining yellow at 90 degrees with purple at 270 degrees. That’s a straight angle in this diagram, so immediately you have a question of which of two equally plausible angle bisectors you ought to use, the left or the right? And further, neither really seems to give a satisfactory answer; it seems dubious that yellow and purple would combine to make either red-orange or cyan.

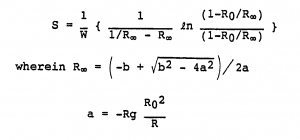
But also as with any model, you can investigate more deeply and refine it further, possibly at various levels of depth and detail. So for example, if you are building a color printer, and need to determine just how much of each color of toner to use to reproduce the color that the computer user wants to see on the printout, then you’re going need a more precise model of color combination, such as the Kubelka-Munk equation, shown below. While we’re not going to go into the details of this equation here, it serves to illustrate how math is a tool that can be used to model and understand the world around us in a huge variety of ways and at a great range of levels, touching on nearly every aspect of life, including the aesthetic and artistic worlds.
Kubelka-MunkEquation


Dallas Arts District: Hunt Oil Building

huntoil
As you walk from Klyde Warren Park to the Dallas Museum of Art, you will pass by the Hunt Oil building. Its facade features the intersection of two cylinders, a narrower vertical one and a much larger-radius horizontal one. The curve where the two surfaces intersect is highlighted in silver trim. This is a beautiful, sweeping curve that does not lie in any one plane in space. It does not correspond to any familiar, simple curve; it’s not an ellipse or parabola or helix, etc. Such curves have been studied by mathematicians, however, and are called Steinmetz curves. It’s wonderful how math shows us that beautiful complexity can arise even from simple combinations of very simple shapes, such as these cylinders.


Dallas Arts District: Klyde Warren Park climbing structure

Screen Shot 2017-02-01 at 11.44.10 PM
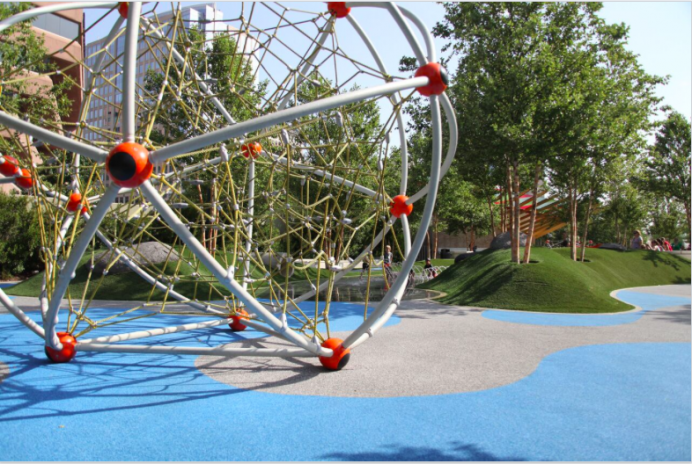
In a park filled with a number of mathematically interesting sights (such as the row of arches along one edge), this climbing structure is arguably the most mathematical object of all. You’ll notice that it is constructed of metal rods joined at the spherical red hubs (with black circles on them). If you look at it further, you will see that exactly five rods meet at every hub, and that every three adjacent hubs are connected in a triangle. So what we have is a structure composed of identical faces, each of which is an regular polygon (in this case, an equilateral triangle), with the same number of faces meeting at every vertex. That’s a very special set of conditions that guarantees that the structure is very symmetric and regular, and it turns out that only five such structures exist, the so-called Platonic solids or regular polyhedra. This particular one is called the regular icosahedron; it has 20 identical triangular faces with five meeting at every vertex. (I recommend passing around a model of the structure.)

Possible aside: Euler’s formula

If you’re looking for more material, you can count the number of faces (20), bars (what a mathematician calls edges) (30), and hubs (which a mathematician would call vertices) (12). Notice that faces plus vertices differs from edges by only two. If you have models of other polyhedra, participants can compare faces plus vertices with edges, and they will always find the difference is two. This remarkable fact is called Euler’s formula, and it applies to any polyhedron that is roughly speaking ball-shaped (as opposed to doughnut-shaped).

Symmetry

Above I claimed that this is perhaps the most mathematical object of all in the park, and so I want to show one specific sense in which that’s true. What is the most amount of symmetry that any three-dimensional object can have? Well, it’s the symmetry of the sphere, in which any rotation whatsoever leaves a sphere unchanged. (Good to illustrate this with a ball or other spherical object.) Do you think there’s a second-most amount of symmetry any object can have? It turns out there is. If you look in the center of the climbing structure, amidst the network of ropes to climb on, the centermost cell of the structure is a polyhedron made up entirely of pentagons and hexagons. You might call it a soccer-ball shape, because it is the same as the traditional pattern of panels on a soccer ball; or maybe a chemist would call it a “buckyball” because it is the same shape as a molecule consisting of 60 carbons that goes by that name; but a mathematician would call it a truncated icosahedron. Let’s look into how much symmetry it has. (This is best done with a model.) You can hold it up so that one vertex is at the top and the pentagon that touches that vertex is facing forward. Then have one of the participants choose any other vertex, and show how you can move that vertex to be at the top with the pentagon facing forward. So there is one symmetry for each vertex, and there are 60 vertices. In addition, this polyhedron is mirror-symmetric (looks the same when reflected in a mirror). That doubles the number of symmetries, because any of the rotations can be combined with a reflection.

Thus, this object has 120 different symmetries, which turns out to be the greatest number of symmetries that any object (other than a sphere) can have. Kids get to play in, around, and on it, absorbing its natural mathematical form. (I should mention that the outer structure, the icosahedron, also has 120 symmetries; it’s just much harder to see what they all are and count them with the icosahedron than with the truncated icosahedron,)

A View to Perot

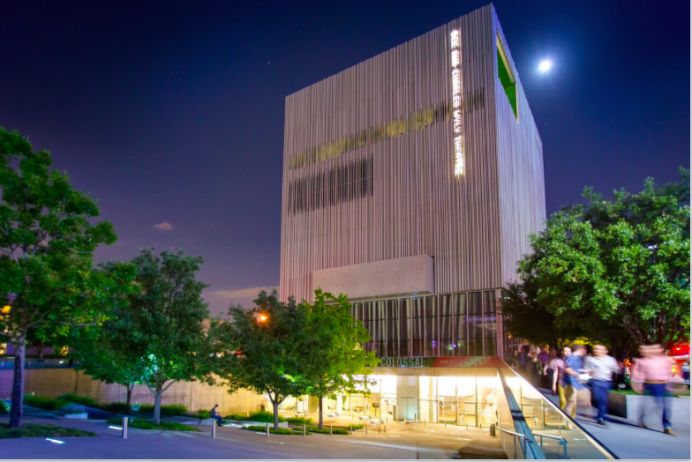
Speaking of Platonic solids in public places, there’s at least one more of them easily visible from this spot. It’s the Perot Science Center, which is in the shape of a very large cube: identical square faces, with three meeting an each corner (or vertex). You might also ask what the most significant departure is from it being a perfect cube. I think that would have to be the large black structure slanting up the side. Why is it there? It houses escalators to get people to the higher levels of the building. This is another example in which concerns about human accessibility affects the mathematics of the structure.


Dallas Arts District: Trees on Harwood Street

As you’re walking along Harwood Street, take a very close look at the glossy leaves of what I was told by one tour participant are magnolia trees all along one side of the street. You should see something roughly like this [but I would love a high-res picture of one of the actual leaves there, showing the full leaf in crisp focus, to replace this stock photo, if somebody could send me one.]
magnoliaLeaf
What you can observe, especially in the upper right of this photo, is a series of similar shapes formed by the veins of the leaf, repeating on smaller and smaller scales toward the edge of a leaf. This type of pattern with the self-similarity of the same motif repeating at a series of scales is called a fractal, and we see such patterns over and over again in nature: in the branching patterns of trees, in the leaves of a fern, in the air channels of a lung, even in the contours of mountains. How does that pattern arise? Why do we see that in a leaf?

The basic mechanism at play here is that the tree needs to provide circulation to all parts of the leaf, to provide nutrients and to collect the products of the leaf’s photosynthesis. That circulation travels along the veins of the leaf. But a vein is basically a linear, or 1-dimensional structure; whereas the leaf spans a surface, or a 2-dimensional structure. So there seems to be a fundamental mismatch, and the tree would seem to have a problem nourishing the entire leaf.

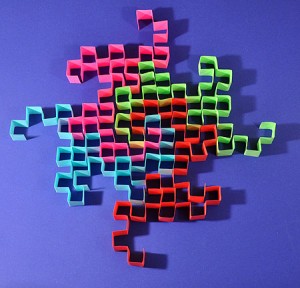
However, as the image below shows, it is possible to twist, wiggle, or fold up a linear structure (in this case, a strip of paper) so that it starts to cover or at least come near nearly every point across a surface. DragonCurve This particular structure is known to mathematicians as the “dragon curve”, and if we made finer and finer versions of it with more and more folds it would come closer and closer to actually covering the surface of a table.

When you take a linear structure and fold it like this, it starts to take on some characteristics of the higher dimensional structure that it is occupying. So much so that, in a certain mathematically measurable and precise way, it takes on a fractional dimension between 1-dimensional and 2-dimensional. That’s where the word “fractal” comes from — it refers to the FRACTional dimensionALity of these types of structure.

That’s why you see them in natural settings like this leaf. The tree, faced with the task of circulation to a 2-dimensional leaf using 1-dimensional veins, has naturally evolved a repetitive, self-similar structure spanning multiple scales, i.e. a fractal, to bridge the gap between these dimensions.


Dallas Arts District: Nasher Sculpture Center

nasher_sculpture_center_4         Nasher_Sculpture_Center-Dallas-TX

Math and Nature

Among other things, math is a tool we can use to understand the natural world. To do that, we need to start with data — often measurements of things we find around us. You and the folks on your tour can try your hand at it right here with the bamboo growing at the corner of the Nasher sculpture center. What are some aspects of the bamboo that we could measure? There are lots: number of leaves on a stalk, height of the first leaf on a stalk, circumference of a stalk, separation of the “joints” on a stalk, and many more. So choose a couple with your participants, and get them to generate data. (I would limit it to just two variables of your choice.) Then you can eyeball the data, or even make a quick, rough scatterplot of the data on your portable whiteboard, to see if there appears to be a relationship between the variables. For example, it appears that the stalks that have longer segments also have larger circumferences. Then you could discuss what the relationship you find, if any, tells you about the plant.

Renzo Piano’s Favorite Ratio

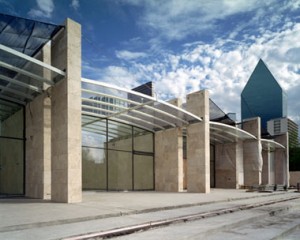
Turning from the natural to the built world, you can tell the tour participants that in the construction of this building, the architect Renzo Piano felt there was one geometric ratio that produced the most pleasing, harmonious forms, so he used it over and over again throughout numerous different features of the building and its rooms. You can ask them to guess what ratio that might have been. You may get guesses of the golden ratio, simply because that is often touted as a ratio that recurs in architecture, or you may get other guesses, or no guesses at all. In any case, once you’ve tried the guessing route, you should suggest that the folks on the tour discover the ratio by measuring things. You will all soon find that the ratio is 2:1, and you can find it in the stones that make up the walls, the paving stones on the sidewalk outside the building, the bays in the front of the building (ignoring the slight arc at the top, they are 32 feet wide and 16 feet tall), and in many other places. I should note that if you look at the main doorway inside one of the bays, you will find that they are 10 feet tall in a half-bay that is 16 feet wide. That’s not a 2:1 ratio, and in fact it is pretty close (between 1% and 2% off) to the golden ratio. That could be a coincidence, or it could be a sly nod to those who adulate the golden ratio in architecture.


Dallas Arts District: Across from the Meyerson Symphony Hall

Dallas_Meyerson_Center_02
You may want to pause to admire the Meyerson Symphony Hall across the street from it, where you can appreciate the architecture by I.M. Pei which deliberately uses the motifs of square and circle in opposition to each other to create dramatic tension. Look for all of the places where you can see circles inside of squares and vice versa. You may also want to take note of the window framing that slants up the side of the curved windows on the left-hand side of the building in this view. Since that window has a larger circular footprint at its bottom than an its top, it is a section of a cone, and the framing appears to have a constant rate of climb up the cylinder as it wraps around. That would make that curve in space something known as a a conchospiral, shown in this reference to be the same as the curve that a moth flies along as it is attracted to a lamp at night. Mathematics shows us why the same beautiful structures show up in circumstances as disparate as an opera hall and the flight of a moth.

Multivariable calculus

If you look down at the ground near the side of the street, opposite the Meyerson, you will see that it is paved with thousands of small square stones. On the other hand, the surface has numerous undulations and contours, sculpted by natural forces such as the growth of tree roots, the running of water in the earth beneath the stones, and presumably a host of other natural forces. Yet nothing over the years has changed the fact that the top surface of each stone is perfectly flat and perfectly square. So building on what we saw on the Texas Sculpture Walk in the Jesus Moroles sculpture, a complex curved surface in space can be realized (or at least approximated) as an assemblage of innumerable small flat elements. This perspective on curved surfaces is a very powerful tool to analyze and understand them, and lies at the heart of what’s known as multivariable calculus. But we can appreciate it here as the duality between the natural landscape that exists in reality and the regular grid of flat squares that human engineering has inscribed thereupon.

A really big number

Especially on a tour with younger kids, I feel like it’s often a good idea to highlight one really big number. The grid of stones here provides an excellent opportunity for that. You can highlight that mathematics isn’t only about getting the exact answer, it’s also about estimating, and that all we want to do here is estimate the number of stone blocks. So we can ignore a few blocks missing here or there or slight irregularities in the pattern. You can discuss strategies for estimating the total number of blocks. Most likely you’ll want to treat the grid as a big long, thin rectangle of blocks, so you need to know the number of blocks in each direction, and then multiply. In one direction it may make sense to count directly (perpendicular to the street), but not in the other direction, along the street, because the grid runs the length of an entire block. Instead, you might use multiplication again, noting that the sidewalk has giant blocks that are pretty regular. So you can have participants count the number of the giant sidewalk blocks and also how many little stones there are per block. Since it’s just estimation anyway, I am not going to include any numbers here, other than that you should end up somewhere between ten and twenty thousand individual blocks. To highlight the size of that number, you can ask the crowd to guess how tall a pile they would make if they were all stacked in a single column, one on top of the other. You can guess they are each about two inches thick (I didn’t see any with their sides exposed, but if you do, you can measure.) So take the estimate of the number of blocks, double it to get inches, divide by 12 to get feet, and then divide by 5280 to get miles; I came up with a stack over a half mile high.


Dallas Arts District: Texas Sculpture Walk at the Hall Arts Center

SpiritInnerColumns

Sculpture

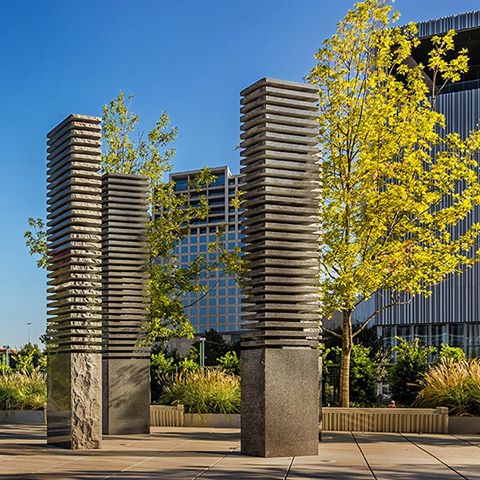
The Texas Sculpture Walk is such fertile ground for bringing out mathematical themes in contemporary sculpture that we could do an entire tour just within this one section of the District. We’re not going to indulge in that right now, to keep this set of tour ideas broadly based in the whole arts district, but I can’t resist mentioning just one of the sculptures, pictured above: Spirit Inner Columns by Jesus Moroles, just at the top of the stairs leading up to the Walk. In the picture, the sculpture might appear to be just three stacks of rectangular pieces of stone. However, in person, you can see that between each rectangular slab there is a smaller piece of stone, and taken together those smaller pieces create a graceful, flowing curve hidden amongst the uniform slabs. Each of the smaller pieces itself is really just a slab of stone, so this artwork shows how a curve can be understood as an assemblage of very numerous infinitesimal pieces, each on its own essentially straight and featureless. This is precisely the same insight that allowed Archimedes to compare the volumes of a sphere and cylinder over two millennia ago, and which underlay the invention of calculus in the 17th century. It underscores how both art and math can be about seeing the world with fresh eyes that will bring out heretofore unrecognized structure and detail.

A Mathematical Fossil

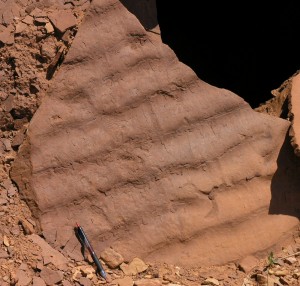
It’s worth stopping at the landing halfway up to the Texas Sculpture Walk to show participants this image. Ripple_marks_in_Moenkopi_Formation_rock_off_of_Capitol_Reef_Scenic_Drive
Tell them that this is a mathematical fossil, and that you’ll explain what you could possibly mean by that when they have found this same pattern somewhere nearby. It won’t take them long to find it in the bottom surface of the fountain/artificial stream that runs by this landing. So what is this image? It is the fossilized remnant of a prehistoric streambed, and it shows the same ripple patterns that you can find in almost any stream today that has a sandy bottom. There’s a very characteristic shape to the ripples: very shallow slope on the upstream side, and a much steeper slope on the downstream side. These patterns arise because of the dynamics of waves in moving water. A very significant topic in mathematics is the analysis of wave phenomena, and that type of mathematics can be used to understand and derive the ripple patterns seen in this fossil, proving that the math we do today was equally valid millions of years ago. Notice that not only do the waves in a stream mold the streambed into this shape, but this shape affects how the water flows by, so the engineers that created this fountain can use the results of this mathematics to create a more naturalistic environment tucked within the urban setting of the Dallas Arts District.


Dallas Arts District: Wyly Theatre entrance and facade

WylyTheatre
There are two main centers of mathematical investigation of the Wyly Theatre highlighted here.

The aluminum-pipe facade

First, if you walk right up to the corner of the building (the near left corner in the picture above) and (on a bright, sunny day) look straight up at the corner amidst the aluminum pipes which adorn the building, and maybe move your head back and forth a bit, you should be able to catch glimpses of bright sun or sky between the pipes and the building. Why would that possibly be? Why wouldn’t the engineers just fasten the pipes tight to the front of the building? The answer lies in the phenomenon of thermal expansion. For any object, there is a linear relationship between the change in length of the object and the change in temperature. You can find that relationship using what’s called the coefficient of thermal expansion, which is based primarily on the material the object is composed of. You multiply the original length of the object, times the coefficient of thermal expansion, times the change in temperature to get the change in length. For aluminum, the coefficient is approximately 0.0000123 (the units of that coefficient are inverse degrees Fahrenheit, for the record). So let’s try to see how much the pipes might change length between the coldest and hottest day in Dallas.

First, how long are the pipes? They run all the way from the roof of the building, which we can look up to find out is 132 feet tall, to the top of the first story, which we can eyeball to be somewhere in the vicinity of 16-20 feet high. So let’s call the pipes 115 feet long, for simplicity; remember, we are just making an estimate. Since the coefficient of expansion is so small, it will be easier to multiply by 12 to get their length in inches. So let’s use an estimate that the pipes are 1,380 inches long.

Next, what could the temperature swing be from the coldest to the hottest day in Dallas? At the time I first gave this tour, there had recently been a low of 18 degrees Fahrenheit, about the coldest anyone could remember for Dallas. In the summer, though, it can get over 100 degrees easily. So let’s say there could be a 90-degree swing between the coldest and hottest day. Then the pipes might change length by 1380×0.0000123×90 inches, which is approximately 1.5 inches.
That might not seem like much, but imagine if the pipes were bolted to the building at the top and bottom. If the separation between those bolts needed to change by 1.5 inches, it would shear the bolts right off, and there might be pipes falling down around the entrance of the building — not exactly a safe situation. So the architects had to allow the pipes to slide up and down a bit in grooves that keep them close to the building, but do not anchor both ends of the pipe. Those grooves create the space through which you can catch a glimpse of sky. Here we see math being used to keep our public buildings safe.

Now, it’s worth pointing out that the building itself will be contracting and expanding with the change in temperature. So why doesn’t that compensate for the expansion of the aluminum? The answer is that the pipes, being nearly pure aluminum, have a very different coefficient of thermal expansion than other materials used in the building. For example, the coefficient of thermal expansion of glass is only about 0.000003, roughly one quarter that of aluminum. It’s the discrepancy in thermal expansion that would cause structural problems if disparate materials were tightly fastened together.

The ramps down to the lower-level entrance

An immediately striking characteristic of the Wyly Theatre is the elaborate system of ramps and steps leading down to the lower-level entrance to the building. We’ll look at them from a mathematical point of view. Building codes require that each step in a series of stairs have the same height, and the same depth (horizontal distance from the edge of one tread to the edge of the next). That means that with properly constructed stairs, there is always a linear relationship between the distance you move horizontally and the distance you move up or down. That linear relationship is measured with what’s called the pitch of the stairs (or ramp), which is simply the vertical distance traveled expressed as a percentage of the horizontal distance traveled. (In mathematics, this quantity is exactly what’s called the slope of a line, although we don’t usually write it as a percentage in that context.) So let’s try to figure out the pitches of the various features of this entranceway.

The easiest to compute is the pitch of the shallow staircase to the right of the building. You can simply take a tape measure to see that each tread is 6 inches high and 50 inches deep. So the pitch of that staircase is 6/50, or 12%. The steeper ramps must have the same pitch, because you can just see next to the staircase that the surface of the ramp is parallel to a long stick laid on the top edges of the treads — and parallel lines always have the same slope, or pitch.

But what about the zig-zaggy more shallow ramp down the middle? What is its pitch? Well, we can measure the maximum height of the low walls which separate one switchback of that ramp from the next; it’s about 32 inches. And we can measure the minimum height of the wall at the other end, it’s about 2 inches. So the ramp drops about 30 inches in one full switchback. Now we need to measure the length of one switchback. Do we measure along the ramp? No, because that’s not the horizontal distance; the ramp is slightly angled. We need to find something horizontal to measure along. Fortunately, there’s a line of re-bar holes on every one of these walls that we can use as a guide to horizontal measuring, and you will find that the horizontal length of each ramp is about 30 feet, give or take. So is the pitch of this ramp 30 inches over 360 inches? No, because as the diagram below shows, one full switchback is two ramps, each 30 feet long, that each drop the same amount. So each one drops 30/2 = 15 inches, over 360 inches, for a roughly 4.2% pitch on these ramps.WylyRampsI think it’s now important to ask why the architects bothered to build this extra zig-zag ramp in the middle. The answer is for handicapped accessibility, and so we see that mathematics is being used to understand and plan for the needs of all to be able to access this civic building. The Texas Accessibility Code specifies a maximum pitch that’s safe for those who need to move about in wheelchairs.

(You might at this point ask what that maximum is. Based on the measurements just taken, it’s quite possible you will get suggestions of four or five percent pitch. However, it turns out that the code maximum is 8% pitch. This could spark further discussion as to why, if the maximum was 8%, would the architects have planned such a long ramp only about half the allowed pitch? I don’t know the true answer, but some possibilities that have been suggested are to make the theatre even more welcoming to those in wheelchairs, or because this way the central shallow ramp system divides the entire entrance area into roughly equal thirds, creating a pleasing symmetry to the design. Symmetry is another mathematical concept with strong links to aesthetics and the arts, because most people find symmetry to be inherently attractive.)

There are a couple of other footnotes that we might add here. The shallow ramp travels in a zig-zag fashion. Why didn’t the architect make it straight? The answer is pretty clear; with the required low pitch, if that ramp were straight, it would have to start across the street at the opera house to make it down to the entrance level of the theatre — not a very practical arrangement. What’s interesting here is that a process of folding the ramp up into a zig-zag allowed a longer ramp to fit in a shorter space. Ways that structures can be folded in two and three dimensions are another subject of mathematical study — there is an entire area of mathematical origami — and one with significant practical uses. There are many cases where a large structure must be fit into a small space in a way that will unfold reliably and easily. You can have participants think of such examples; a couple are airbags into your steering wheel or solar collectors for a satellite into the rocket payload bay.

If you’re looking for additional measurements to take, you can examine the pitch of the sidewalk from the street corner up to the side of the building. Is it handicapped-friendly? (It is, but I will leave the measurements that determine its pitch up to you; some creativity is required to get the rise and the horizontal distance for this ramp.)